Debug Tooling
Sometimes it is hard to know why your UI is behaving unexpectedly. To help you with debugging, Lunex offers additional tooling that should make your life a little bit easier.
To enable it, you have to add UiLunexDebugPlugin::<R_2D, R_3D> to your application.
The generics are constants used for RenderLayers inside the debug plugin.
R_2D: Specifies which render layer should 2D gizmos use.R_3D: Specifies which render layer should 3D gizmos use.
If you don't use RenderLayers for any other purpose, then you can add the plugin with these values:
UiLunexDebugPlugin::<1, 2>This also means that you have to add a properly configured RenderLayers component to your cameras
if you want to see these outlines.
-
For
Camera2d:RenderLayers::from_layers(&[0, 1]) -
For
Camera3d:RenderLayers::from_layers(&[0, 2])
This will draw gizmo outlines around all UI nodes, allowing you to see their positions and sizes.
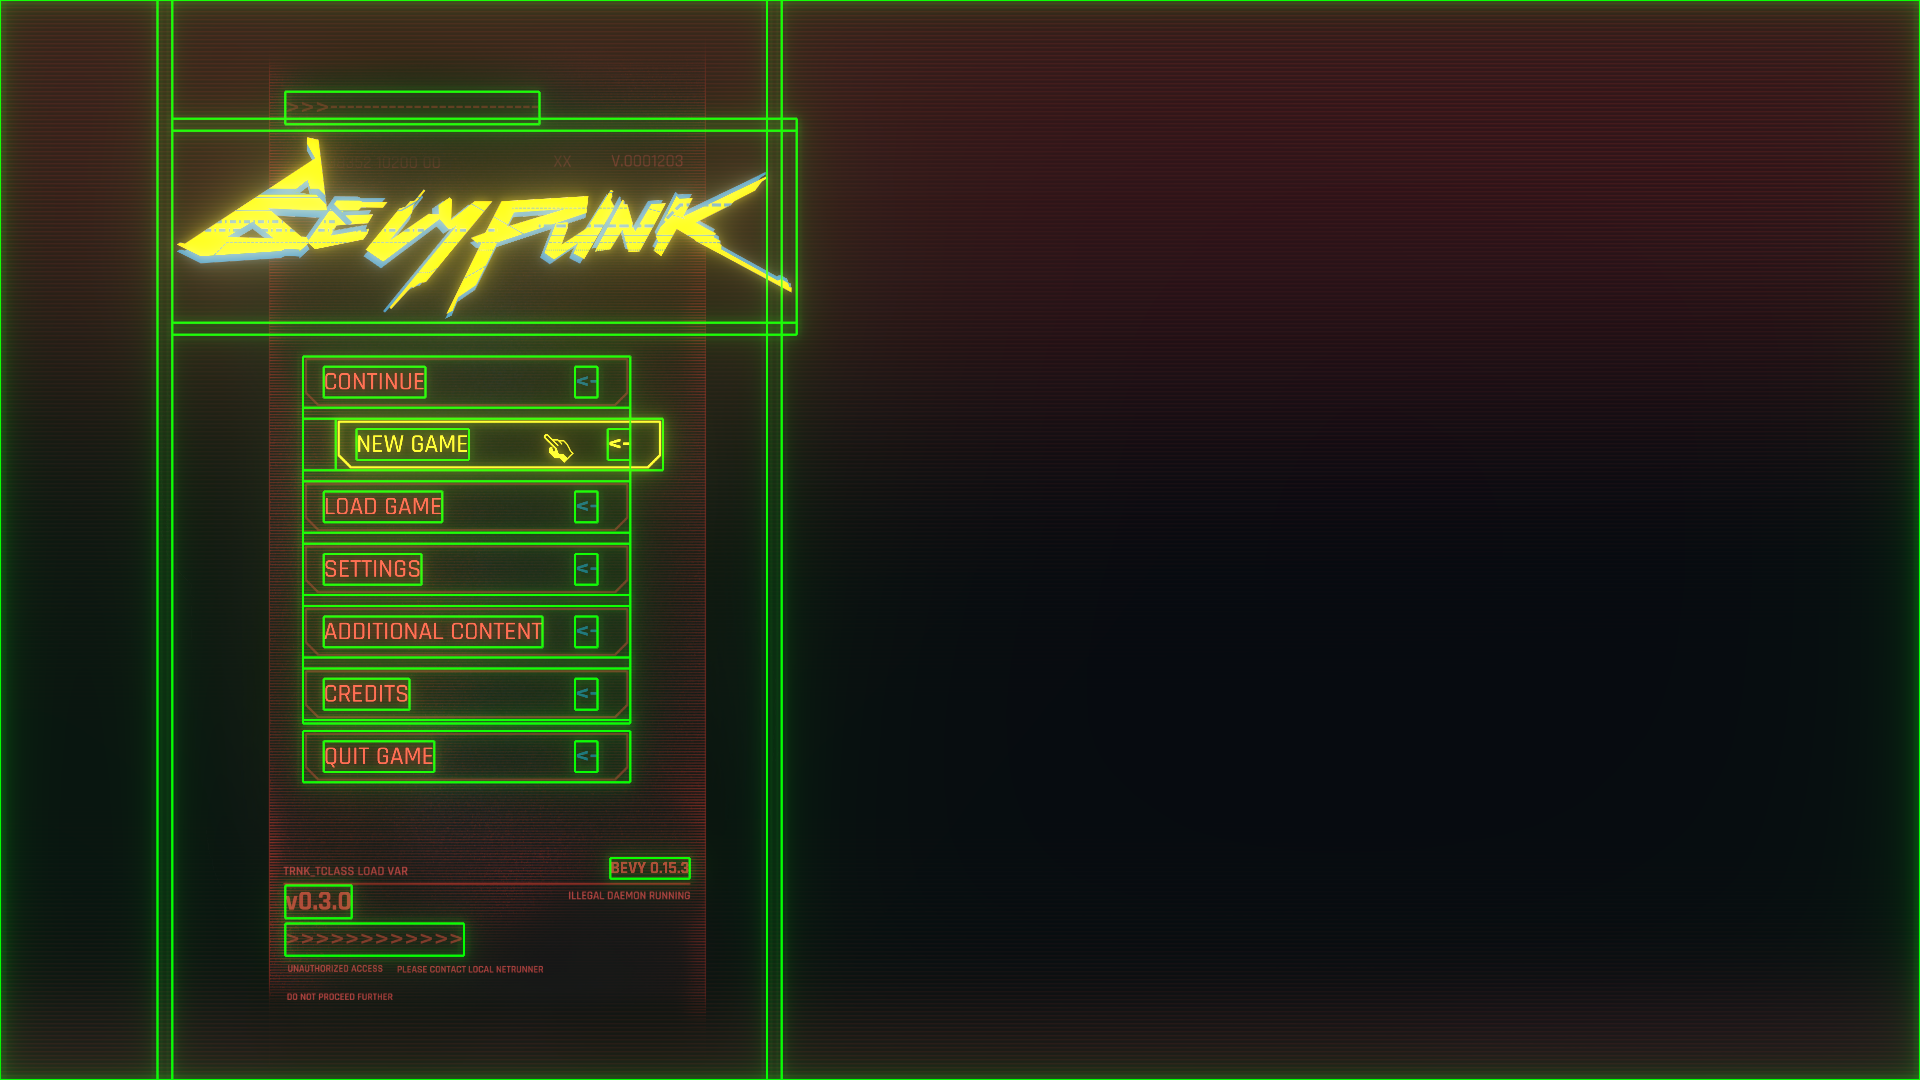
Additionally, it will print the layouts to the terminal whenever a change is detected.
▶ 11v1 ⇒ [w: 1920, h: 1080]
  ├─ Background ⇒ [w: 1920, h: 1080, d: 1] ➜ Solid
  └─ 13v1 ⇒ [w: 595, h: 1080, d: 1] ➜ Solid
  ┆  ├─ Panel ⇒ [w: 624, h: 1134, d: 2] ➜ Window
  ┆  ├─ 15v1 ⇒ [w: 624, h: 216, d: 2] ➜ Window
  ┆  │  └─ Logo ⇒ [w: 624, h: 192, d: 3] ➜ Solid
  ┆  └─ 17v1 ⇒ [w: 327, h: 367, d: 2] ➜ Window
  ┆  ┆  ├─ New Game ⇒ [w: 327, h: 51, d: 3] ➜ Window
  ┆  ┆  │  └─ 23v1 ⇒ [w: 327, h: 51, d: 4] ➜ Window
  ┆  ┆  │  ┆  ├─ 24v1 ⇒ [w: 113, h: 31, d: 5] ➜ Window
  ┆  ┆  │  ┆  └─ 25v1 ⇒ [w: 22, h: 31, d: 5] ➜ Window
  ┆  ┆  ├─ Settings ⇒ [w: 327, h: 51, d: 3] ➜ Window
  ┆  ┆  │  └─ 31v1 ⇒ [w: 327, h: 51, d: 4] ➜ Window
  ┆  ┆  │  ┆  ├─ 32v1 ⇒ [w: 98, h: 31, d: 5] ➜ Window
  ┆  ┆  │  ┆  └─ 33v1 ⇒ [w: 22, h: 31, d: 5] ➜ Window
  ┆  ┆  └─ Quit Game ⇒ [w: 327, h: 51, d: 3] ➜ Window
  ┆  ┆  ┆  └─ 43v1 ⇒ [w: 327, h: 51, d: 4] ➜ Window
  ┆  ┆  ┆  ┆  ├─ 44v1 ⇒ [w: 111, h: 31, d: 5] ➜ Window
  ┆  ┆  ┆  ┆  └─ 45v1 ⇒ [w: 22, h: 31, d: 5] ➜ Window